Friday, March 24, 2017

BIAPPS STANDARD COLUMNS AND DATATYPES

Please find the BIAPPS columns and their standard datatypes in below table.

COLUMN
DATATYPE
_WID
NUMBER(10)
_.AMT/_QTY
NUMBER(28,10)
_ID
VARCHAR2(80 CHAR)
CODE
VARCHAR2(30 CHAR)
_FLAG
CHAR(1)
INTEGRATION_ID
VARCHAR2(80 CHAR) -- Dimension
VARCHAR2(400 CHAR) -- Fact
DATASOURCE_NUM_ID
NUMBER(10)
ETL_PROC_WID
NUMBER(10)
X_CUSTOM
VARCHAR2(10 CHAR)
TENANT_ID
VARCHAR2(80 CHAR)

Wednesday, March 22, 2017

ODI ERRORS AND SOLUTIONS

  1.  The error ODI - 1226/1240 occurs if we miss to select sub select option in  blue interface against the yellow interface.


2.  The error ODI - 1228 occurs if there is a data issue with the source like if the target table is having lesser precison than the source query or there is a data issue with source like numeric column storing character values etc.
 Note: This is mostly source side issue, so check the source query and data carefully.

   3. The error ODImay error if precision is missing for columns in target table.
                  

Monday, March 13, 2017

STRING CONCATENATION USING XMLAGG AND LISTAGG FUNCTIONS


 STRING CONCATENATION USING XMLAGG AND LISTAGG FUNCTIONS

XMLAGG function will return data in CLOB DATATYPE.

LISTAGG function will return data in VARCHAR2(4000 CHAR).

------------------XMLAGG QUERY---------------------------

SELECT FM_FORM_MST_B.FORMULA_ID    FORMULA_ID,
       RTRIM(XMLAGG(XMLELEMENT(E,COLNAME,',').EXTRACT('//TEXT()') ORDER BY COLNAME).GETCLOBVAL(),',') X_REASON_FOR_REVISION
FROM    APPS.FM_TEXT_TBL   FM_TEXT_TBL, APPS.FM_FORM_MST_B   FM_FORM_MST_B
WHERE   (1=1)
      AND (FM_TEXT_TBL.TEXT_CODE (+)=FM_FORM_MST_B.TEXT_CODE)
      AND (FM_TEXT_TBL.PARAGRAPH_CODE (+) = 'RSRV')
      AND FM_TEXT_TBL.LINE_NO <> -1
GROUP BY FM_FORM_MST_B.FORMULA_ID;

----------------QUERY TO TRIM STRING 3900 CHARACTERS-----------------------

  SELECT FM_FORM_MST_B.FORMULA_ID FORMULA_ID,
         DBMS_LOB.SUBSTR( RTRIM(XMLAGG(XMLELEMENT(E,FM_TEXT_TBL.TEXT,',').EXTRACT('//TEXT()') ORDER BY FM_TEXT_TBL.LINE_NO).GETCLOBVAL(),',')  , 3900,1) X_REASON_FOR_REVISION
--If you set the limit to 4000 characters the query might fail as sometimes it might extend beyond 4000 characters so setting it to 3900 characters.
    FROM APPS.FM_TEXT_TBL FM_TEXT_TBL, APPS.FM_FORM_MST_B FM_FORM_MST_B
    WHERE     (1 = 1)
         AND (FM_TEXT_TBL.TEXT_CODE(+) = FM_FORM_MST_B.TEXT_CODE)
         AND (FM_TEXT_TBL.PARAGRAPH_CODE(+) = 'RSRV')
         AND FM_TEXT_TBL.LINE_NO <> -1
GROUP BY FM_FORM_MST_B.FORMULA_ID;

------------------LISTAGG QUERY-----------------------

SELECT 
    FM_FORM_MST_B.FORMULA_ID    FORMULA_ID,
    LISTAGG (FM_TEXT_TBL.TEXT, '') WITHIN GROUP (ORDER BY FM_TEXT_TBL.LINE_NO)    X_REASON_FOR_REVISION
FROM    APPS.FM_TEXT_TBL   FM_TEXT_TBL, APPS.FM_FORM_MST_B   FM_FORM_MST_B
WHERE    (1=1)
 AND (FM_TEXT_TBL.TEXT_CODE (+)=FM_FORM_MST_B.TEXT_CODE)
AND (FM_TEXT_TBL.PARAGRAPH_CODE (+) = 'RSRV')
AND FM_TEXT_TBL.LINE_NO <> -1
GROUP BY FM_FORM_MST_B.FORMULA_ID;

-------------------------------------------------------

EBS QUERY TO GET OPM FORMULA - REASON FOR REVISION

  SELECT fm_form_mst_b.formula_id formula_id,
         LISTAGG (fm_text_tbl.text, '')
             WITHIN GROUP (ORDER BY fm_text_tbl.line_no)
             reason_for_revision
    FROM apps.fm_text_tbl fm_text_tbl, apps.fm_form_mst_b fm_form_mst_b
   WHERE     (1 = 1)
         AND (fm_text_tbl.text_code(+) = fm_form_mst_b.text_code)
         AND (fm_text_tbl.paragraph_code(+) = 'RSRV')
         AND fm_text_tbl.line_no <> -1
GROUP BY fm_form_mst_b.formula_id;


Monday, February 27, 2017

EBS QUERY TO FIND INVENTORY CYCLE COUNT

SELECT To_char(mtl_cycle_count_entries.cycle_count_entry_id) cycle_count_entry_id,
       hr_all_organization_units.name                        organization_name,
       mtl_system_items_b.segment1                           inventory_item,
       CASE
              WHEN mtl_cycle_count_classes.hit_miss_tolerance_negative IS NULL THEN mtl_cycle_count_headers.hit_miss_tolerance_negative
              ELSE mtl_cycle_count_classes.hit_miss_tolerance_negative
       END hit_miss_tolerance_negative,
       CASE
              WHEN mtl_cycle_count_classes.hit_miss_tolerance_positive IS NULL THEN mtl_cycle_count_headers.hit_miss_tolerance_positive
              ELSE mtl_cycle_count_classes.hit_miss_tolerance_positive
       END hit_miss_tolerance_positive
FROM   apps.mtl_cycle_count_entries,
       apps.mtl_cycle_count_classes,
       apps.mtl_cycle_count_headers,
       apps.mtl_cycle_count_items,
       apps.hr_all_organization_units,
       apps.mtl_system_items_b
WHERE  mtl_cycle_count_entries.organization_id = mtl_cycle_count_classes.organization_id
AND    mtl_cycle_count_entries.cycle_count_header_id = mtl_cycle_count_classes.cycle_count_header_id
AND    mtl _cycle_count_entries.cycle_count_header_id = mtl_cycle_count_headers.cycle_count_header_id
AND    mtl_cycle_count_entries.inventory_item_id = mtl_cycle_count_items.inventory_item_id
AND    mtl_cycle_count_entries.cycle_count_header_id = mtl_cycle_count_items.cycle_count_header_id
AND    mtl_cycle_count_classes.abc_class_id = mtl_cycle_count_items.abc_class_id
AND    mtl_cycle_count_entries.organization_id = hr_all_organization_units.organization_id
AND    mtl_cycle_count_entries.inventory_item_id = mtl_system_items_b.inventory_item_id;

Wednesday, February 22, 2017

LINUX COMMAND TO SHIFT FROM GUI TO COMMAND MODE AND VISE VERSA

Ctrl+Alt+F2 to shift from GUI mode to command mode.
Ctrl+Alt+F7 to shift from command mode to GUI mode (if this doesn’t work, try Ctrl+Alt+F8).

Wednesday, February 15, 2017

INFORMATICA DEBUGGER

Introduction 

Informatica Debugger is inbuilt tool in informatica designer for testing and tracking errors in Informatica at run time, the data can be checked at each transformation level and can be modified for testing and analyzing. The informatica mapping should be in valid state for debugging the mapping. To debug a mapping, configure and run the Debugger from within the Mapping Designer. The Debugger uses a session to run the mapping on the Integration Service. When you run the Debugger, it pauses at breakpoints and you can view and edit transformation output data.

Debugger can be used in the following cases:
      Before a session run: Debugger can be used to test the mapping before the actual session run.
      After a session run: If a session fails or inserts unexpected results in the target, Debugger can be used to identify the cause.

Running Debugger

We can start Debugger from Informatica Designer, in toolbar click on mappings tab and go to Debugger and click on start Debugger or by pressing F9 Key.


                   The following window appears


Click next and select the integration service and type of session on which your mapping runs. Three types of sessions can be created
·         Use an existing session
·         Use an existing reusable session
·         Create a debug session instance
If reusable session or non-reusable session is already created for the mapping then we can use those sessions to debug the mapping or we can create a new debug session.


                  Select create a debug session instance and click next. Enter the connection details.


                   Click Next and enter the Session Config details.


                    Click Next , Target Options Window appears


Select the target table. Load the data into the target table or discard the data by deselecting or selecting the Discard target data option and click finish.
If mapping consists of mapplet, select the mapplet to view the data flow of the mapplet and debug. Click ok.


The Debugger opens in the designer as it is integrated with it. 

Debugger Interface

       Debugger consists of following Windows
a.       Instance Window : View how data is transformed in a transformation.
b.      Target Window :  View what data is getting inserted, updated, deleted or rejected into the target instance.
c.       Mapping Window : The dataflow between transformations can be viewed.
d.      Debugger Log : This window shows logs from the Debugger.
Below screenshot shows the windows in the Mapping Designer.


To start the debugger process, go to toolbar--> Debugger-->Next Instance or press F10


The data in the current transformation can be viewed in the instance window. Yellow colored arrow mark on the transformation indicates the current transformation. Repeat the above step to view data flow from one transformation to the other.


Finally the data in the target table can be viewed in the Target Instance window.


Note: We can modify the data in the Instance window by double clicking on the column value to check the resultant data. This helps in testing the data with expected input value.

Breakpoints

    Breakpoints are used to break the flow of the data i.e., data flow can be paused at a transformation when user wants to view the data instead of viewing whole data flow. We can setup the break points before or after starting the debugger instance. Breakpoints help to debug the issue faster.
For example, we want to see data in expression transformation for EMPID=100.
There are two types of Breakpoints
a.       Error Breakpoints: Debugger pauses when the Integration Service encounters error conditions such as a transformation error. You also set the number of errors to skip for each break point before the Debugger pauses.
b.       Data Breakpoints: Debugger pauses when the data break point condition evaluates to true. You can set the number of rows to skip or a data condition or both.
Start the Break point Window from Mapping -> Debugger -> Edit Breakpoints or press Alt+F9 


The Breakpoint window opens, select the transformation on which breakpoint is to be created and click on add and in the conditions tab click the Add new column to this table button and enter the condition click ok.


Red colored stop symbol appears on the transformation indicating that breakpoint has been created on it. When the debugger processes the data, flow stops at the breakpoint. Similarly we can create Error Breakpoint.

Evaluating Expression

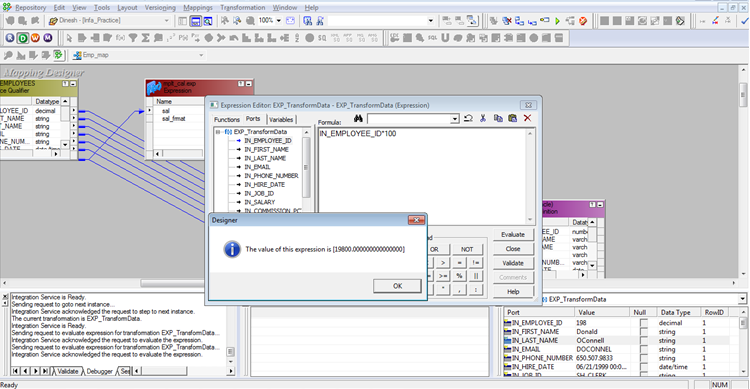
          We can validate expression condition defined in mapping to see whether it is returning the expected output while debugging the mapping. Right click on a transformation and click evaluate expression in the expression editor; enter the expression which you want to evaluate.


The expression output will be displayed in the output window.


Conclusion :

Repeat the above process for identifying the issue.
The mapping should be in valid state for debugger to work.
It might not work properly for complex mappings.